Grafana Performance Metrics
From UCSC Genomics Institute Computing Infrastructure Information
We are tracking server and cluster node performance metrics over time via the Grafana software suite. This is only available in the firewalled/PRISM area. If you want to see past and present performance metrics of a particular server or phoenix cluster node, make sure you are connected to the VPN, then navigate to this website:
http://grafana.prism/dashboards
Then login using the following credentials:
username: guest
password: MoreStats4me
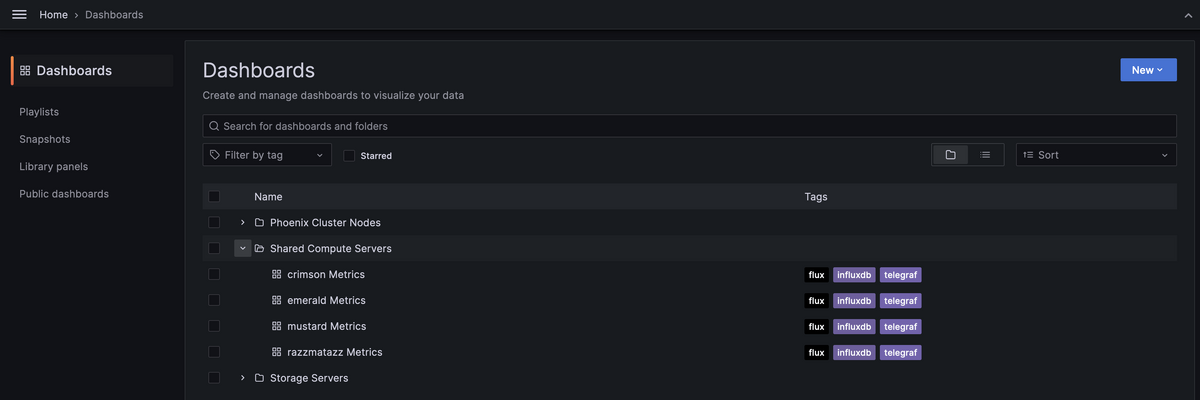
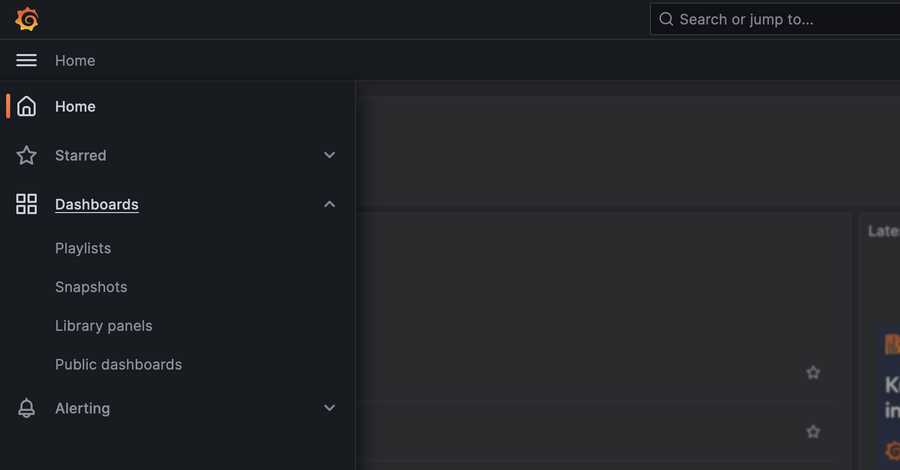
Once logged in, click the small button on the top left of the window with the three small horizontal bars in it, and navigate to the "Dashboards" menu item.

From there, you should be able to see the various sub-folders of the different dashboards for different classes of machines.